


If you hang around a college campus long enough, you quickly begin to realize that a lot of the stereotypes are true, especially on the faculty side of things. For example, every college has a whole bunch of “deadwood.” These are professors who got to full professor about ten years ago and just stopped doing anything more than the bare minimum. They are just counting down the days until they retire. And then you’ve got the “reformer.” This is a faculty member who was hired right out of grad school and has big plans for how to change the curriculum or the educational goals or something else. They typically burn out before they get to tenure review, because the pace of change in academia is absolutely glacial.
There are also a ton of tropes about which departments tend to have the most liberal and conservative faculty. I know that when I was at Eastern Illinois University, the folks who led the faculty union almost always came from the humanities departments (particularly English and history). By contrast, the professors in the business school had next to nothing to do with the rest of the university. They had the nicest cars, the most up-to-date building, and the lowest level of union membership.
That got me wondering if the students can sort of suss those things out when it comes to choosing their college major. Do the Alex P. Keaton types know that they should gravitate toward a degree in finance, while the more hippy-inclined students know that they can find a lot of likeminded individuals in the arts? I get asked all the time if more religious students tend to cluster in one type of major, and I’ve not really been able to answer that question with any real specificity—until now.
The Foundation for Individual Rights and Expression (FIRE) has been doing an annual survey that I just love because its focus is squarely on college students. The most recent version has a sample size in excess of 68,000, and they are drawn from more than four hundred institutes of higher learning spread throughout the United States. There’s a section of the survey that asks students to indicate their major, with about fifty possible options.
Let me just start by showing you the basic religious composition of the 25 largest majors, according to this dataset. I tried to sort so that the least Christian majors are at the top, and the most Christian ones are at the bottom.
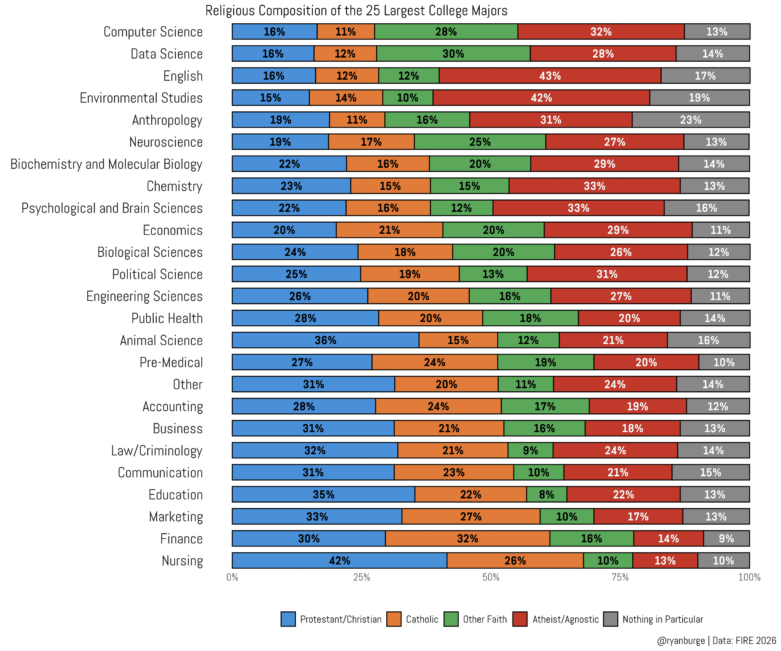
The two most “teched up” majors are the least Christian: data science and computer science. Just 27-28 percent of these folks identify as Protestants, Catholics, or generic Christians. By contrast, about 30 percent in these majors say that they are atheist/agnostic, and another 13 percent are non-religious. In other words, they are about 15 points more apt to be nones than to be Christians.
But they actually aren’t the most likely to be strictly atheist/agnostic. There are two majors who clearly lead in this regard: English and environmental studies. In fact, environmental studies is the most secular of all, with 61 percent of students claiming that they are atheist, agnostic, or of no religion in particular. English is at 60 percent by this metric.
The two most “teched up” majors are the least Christian: data science and computer science.
What majors are at the bottom of the list? Well, there are two that are clearly outliers: finance and nursing. Among the latter group, 68 percent identify as Protestants, Catholics, or generic Christians. It’s 62 percent among the finance majors. For each group, less than a quarter are non-religious. You can see quite a bit of “business”-adjacent majors near the bottom of the list, with marketing, general business, and accounting all being fairly religious.
Of course, I can’t provide all the nuance that I want in just a simple bar graph. For instance, I bet some of you are guessing that a lot of those computer science majors are actually Hindus, Muslims, or Buddhists, and you would be correct. Those types of majors tend to be popular among immigrant students.
To provide even more granularity, here’s a sortable table to poke around this data a whole lot more. The hunch about how computer science and data science students are more likely to be Hindus is absolutely confirmed in this data. In fact, those majors have more Hindus than Catholics. There are lots of fun little oddities to explore in the table (like one third of finance majors being Catholics). So, have fun with that.
Let’s move on to religious attendance.
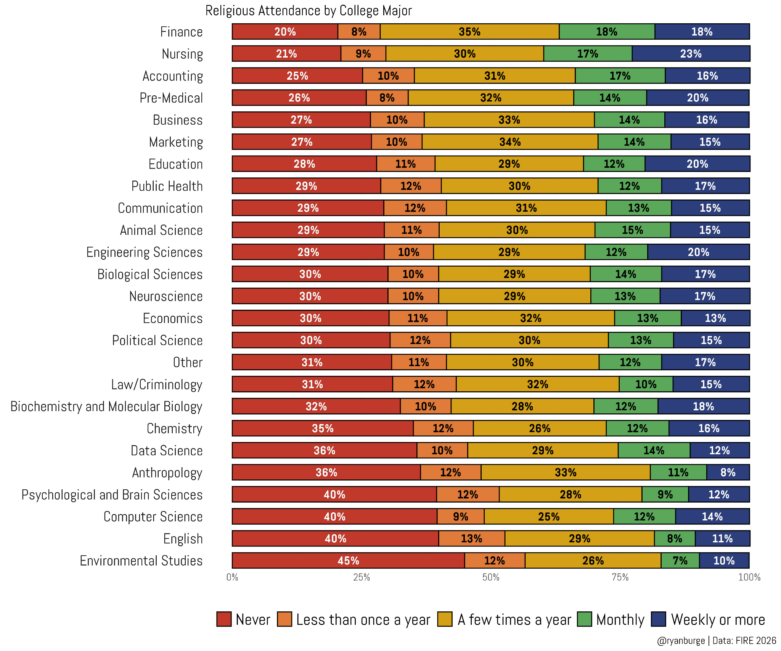
I sorted this graph so that the groups that were the least likely to never attend were up top, and we see basically a repeat of the findings from the first graph: finance and nursing are some of the most religiously active majors on college campuses. In fact, no one goes to church more than aspiring nurses: 23 percent are attending at least weekly. That’s more than double the rate of the full sample (10 percent weekly attenders).
You shouldn’t be surprised to see those English and environmental studies folks at the bottom here, either, based on what we observed in the previous analysis. A majority of both groups say that they attend a house of worship less than once a year. What I did find notable is the anthropology major. Just 8 percent were weekly attenders—that’s the lowest I can find.
But you get a clear impression from this graph that college students are not a particularly religious group, overall. If you pick a random major, the chances of sitting next to a non-churchgoer are at least twice as likely as sitting next to a student who attends on a regular basis.
Now let’s combine both these metrics into a single scatter plot. The x-axis is the share who never attend religious services, and the y-axis is the share who have no religious affiliation. I also added several more majors to the list, including those with at least one hundred respondents. I also color-coded them by general disciplines, and the size of the circles is related to the number of respondents in the sample.
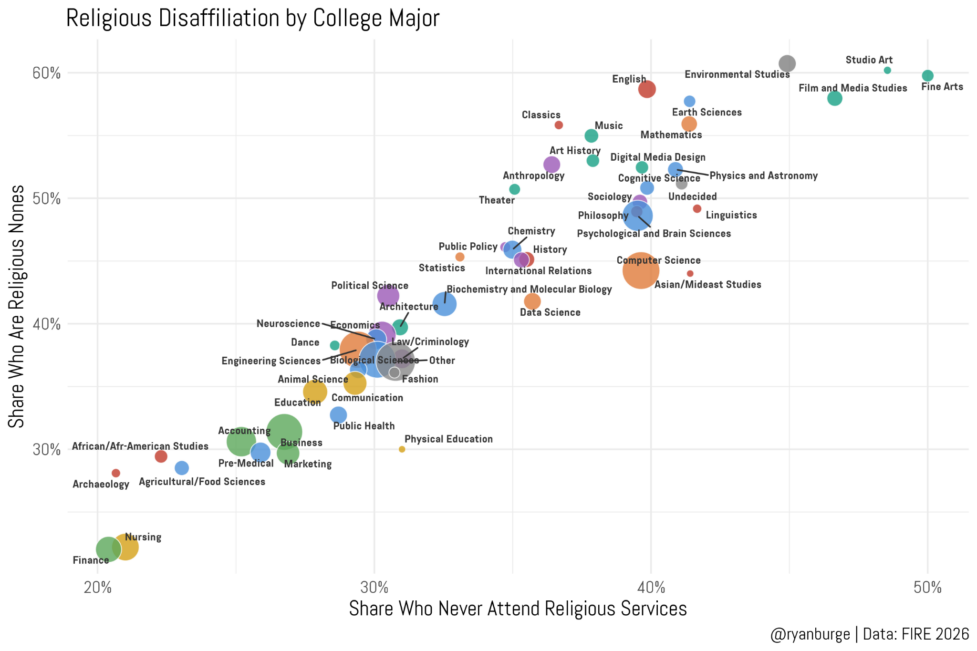
It’s pretty amazing how well these two metrics track each other, right? I mean, it does make sense that the most secular major was also the most likely to have a huge share of never-attenders. But it is surprising how there are no real outliers from the trend line.
Who’s in the top right? The performing arts: studio art, fine arts, and film and media studies. I think I can definitively say that this is the most secular group of disciplines in academia. There are also a bunch more of those green circles in that general quadrant, too: music, art history, and digital media design. But there are a number of other disciplines, too: English, environmental studies, math, and earth science jump out. A strange combination, right?
What about the bottom left? Well, it’s a whole bunch of students in the business school. You can see a lot of darker green circles: finance, accounting, business, and marketing. But also nursing, as we’ve discussed earlier. However, there are some interesting outliers, too. Archaeology and African-American studies are down in this quadrant. Pre-med being in this part of the scatter plot is also very intriguing to me.
Now, I do feel like I am only showing you one side of the coin here. It’s been all religion to this point—belonging and behavior. But we all know that those two factors are intimately related to political viewpoints. I write about this ad nauseam now, but to be Republican/conservative is to be religious. And the opposite is true for the left side of the political spectrum: there are a whole lot more nones among the ranks of liberals.
Let me just visualize partisanship and ideology across all those majors.
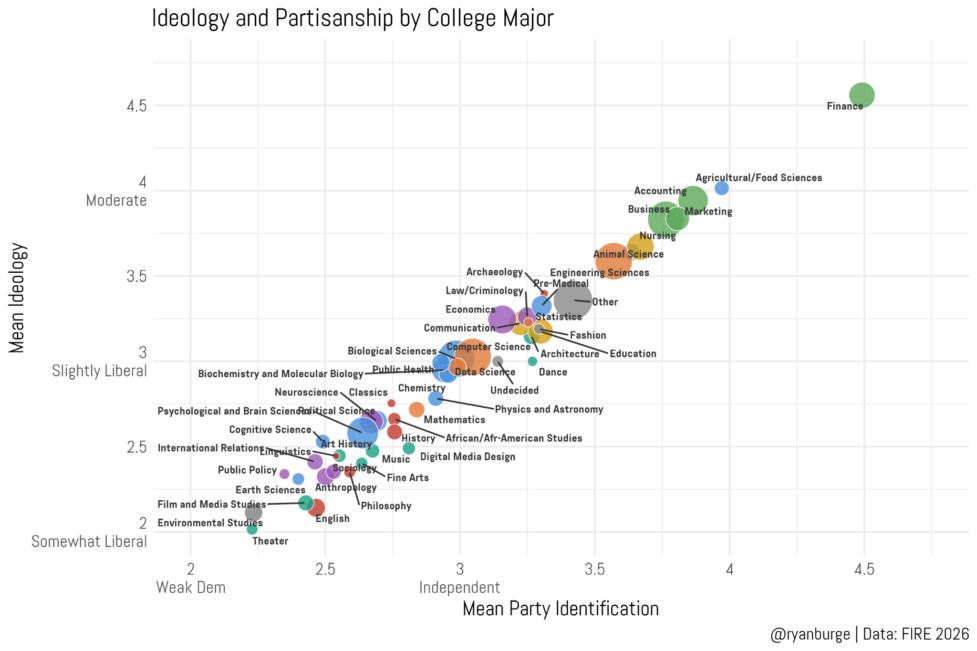
Isn’t it amazing how straight that line is across the diagonal of the plot? Of course ideology is related to partisanship and vice versa, but it’s still visually stunning to see just how strong the correlation is between the two factors. There are basically no majors that are significantly above or below the trend line.
There is one clear outlier, though: finance majors. They are, without a shadow of a doubt, the most right-leaning and Republican of any group on a college campus. And by a significant margin, too. They are about half a point away from the next most conservative group: agricultural and food science majors. There are a whole bunch of green circles in the top right, aren’t there?
The bottom left is also a bunch of majors that fit the stereotype: theater, film studies, English, and environmental studies are all pretty far to the left. I also feel like I need to point out that there are a number of purple circles down there—that’s social sciences. Fields like public policy, anthropology, and sociology are all pretty far left of center. Do note, though, that political science is a bit more centrist than those other social science disciplines.
To cap this off, I wanted to throw both religion and politics into a single graph. So I just built an index for each based on the four measures we have discussed previously. I used the most right leaning and the most left leaning majors as the anchor points, and I think this does a good job of visualizing the relationship between the two.
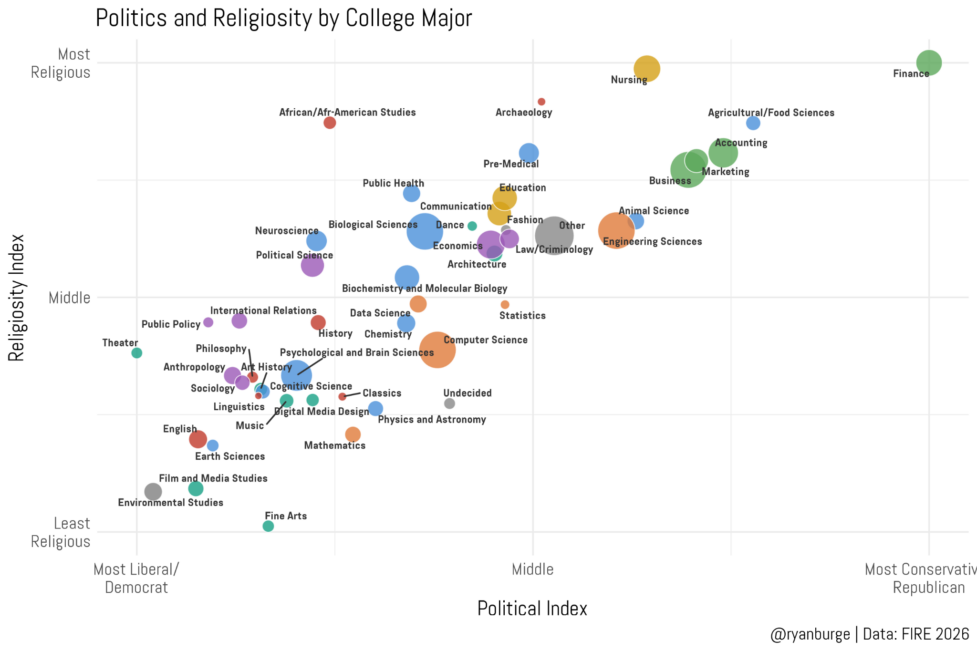
Of course, it’s a bit easy to draw a trend line in this graph, but the points are not so tightly clustered around the middle, like what we observed in the previous graph. That means that more conservative majors tend to be more religious, but there are a number of circles that do deviate quite a bit. For instance, look at nursing. They are one of the most religious majors, but their political views are only slightly right of center. When you compare them to finance majors, you realize that they are just totally different groups of students.
African-American studies also deviates from the norm in a way that I could have probably hypothesized. Lots of those majors are Black college students. Which means that they are left-leaning politically but also pretty religious. That’s why it’s so hard to classify Black Protestants in the larger landscape: they don’t fit neatly into any one box.
I love this kind of data, because it helps shine a flashlight into a darker corner of social science. We know that some majors on campus tend to be more religious or conservative, but it’s nice to actually put numbers to our assumptions.