
It’s the most important feature of American religion and politics that I wish more people understood: the God Gap. Simply put, religious people tend to gravitate toward a conservative political ideology and tend to favor the Republican Party on election day. Among the non-religious, it’s just the opposite—they are more apt to say that they are politically liberal and that they align with the Democratic Party.
But I wanted to try and figure out if that gap may begin to narrow or if it will widen in the future. I used a new dataset I’ve gotten my hands on from the Foundation for Individual Rights and Expression (FIRE), which conducts an annual poll of college students. The total sample size is 68,510 students attending 257 universities across the United States. It’s not a representative sample of all college students, but it is definitely in the ballpark of a solid sample.
There are two questions about religious affiliation and attendance in the survey. That means I have more than enough information to start poking around on the God Gap.
Let me start by showing you the distribution of political ideology based on self-reported levels of religious attendance.
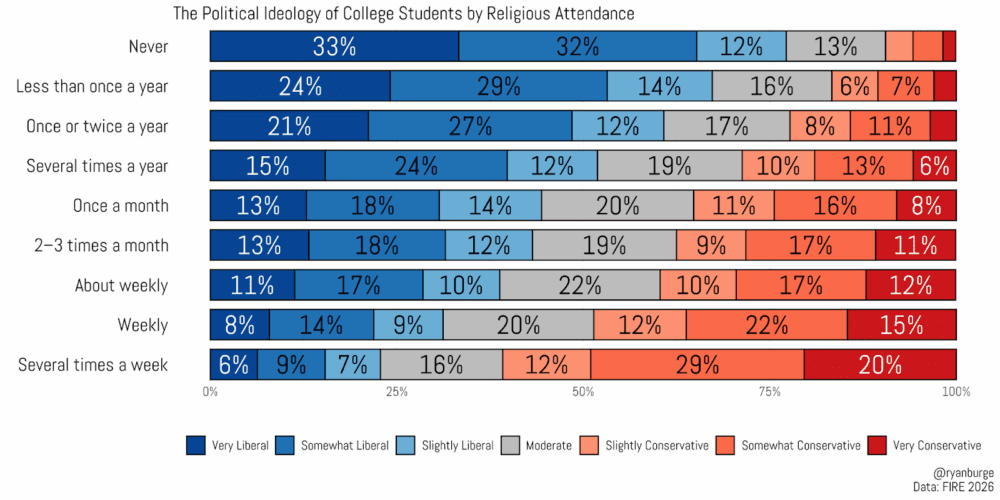
Boy, that is a beautiful cascade of stacked bars. Among college students who report that they never attend religious services, 33 percent report that they are “very liberal,” and nearly the same share (32 percent) indicate that they are “somewhat liberal.” If you throw in the “slightly liberal” portion, you get two-thirds of never-attenders on the liberal side of the spectrum. In contrast, conservatives make up 10 percent of the never-attenders.
As attendance goes up, the liberal share goes down and the conservative responses begin to rise. The liberal share drops below 50 percent of the sample when you get to monthly attendance or more. But here’s a fun fact: the only attendance level where conservatives make up a majority is among those who attend a house of worship multiple times per week. Those folks make up 3 percent of the sample. Meanwhile, the never-attenders are ten times that large (32 percent, to be exact). So, as attendance rises, liberalism drops.
Let me show you the same question, but this time I will break it down by religious affiliation.
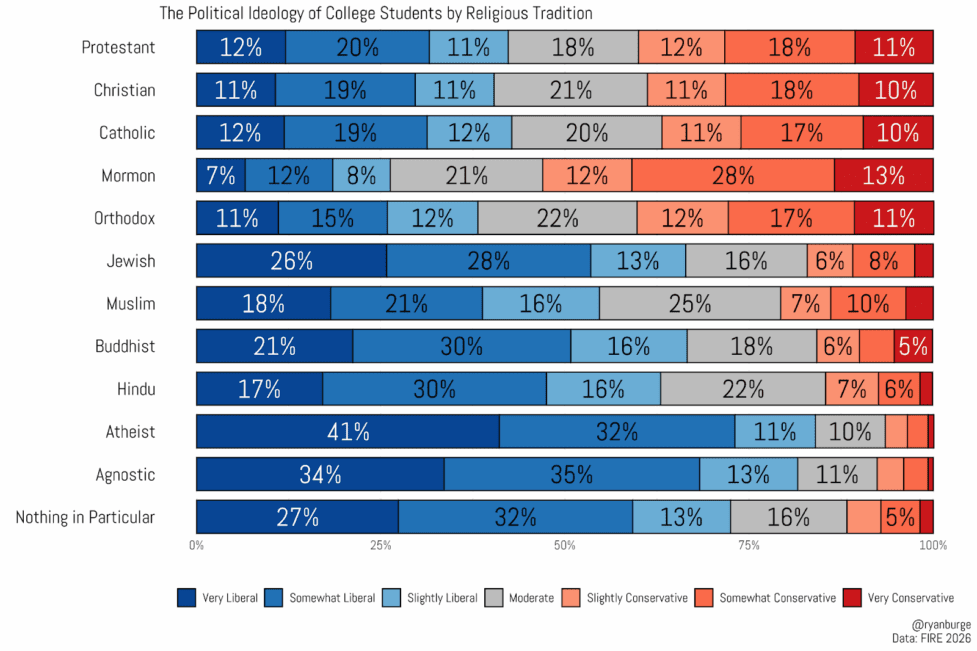
There is clearly one group that stands out from all the rest: Latter-day Saints. Among the LDS in the sample, 53 percent of them describe their political ideology as conservative. No other group comes close. What also jumps out to me is that the other Christian groups in the sample look almost exactly the same. The share who are conservative is right around 40 percent; the share who are liberal is nearly the same. The last 20 percent say that they are politically moderate. In other words, Christians are really purple. That’s an idea that I’m going to return to a bit later.
Now, there are a bunch of traditions where liberals are the majority. They include Jews, Buddhists, Hindus, atheists, agnostics, and “nothings in particular,” too. The group that is the most left-leaning is atheists. A whopping 84 percent of them say they are liberal—2 points higher than agnostics and 12 points higher than “nothings in particular.” It’s also worth pointing out that Jews, Buddhists, and Hindus look pretty similar on this metric, too. Muslims are about 10 points less likely to be liberal than those other groups.
Let me add another dimension to this analysis by throwing in political partisanship, too. I am mapping the mean score for each tradition on two axes—ideology is on the horizontal axis, and partisanship is on the vertical. The size of the points indicates the sample size.
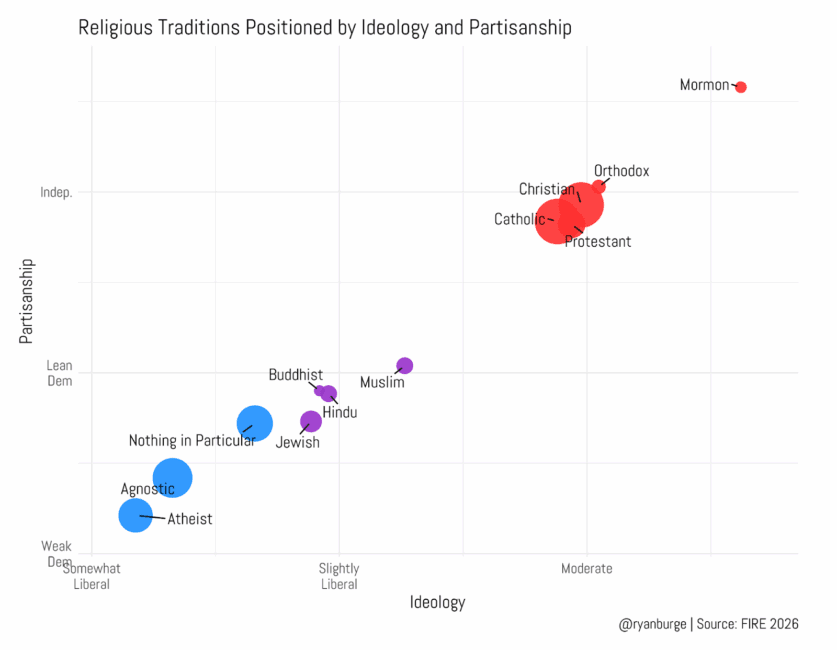
It’s pretty neat how these points fall on a fairly straight line that runs diagonally through the plot. It should come as no surprise that liberals tend to lean toward the Democratic Party, while conservatives go the other direction. It’s also pretty striking how the three broad groups of religious affiliation (Christians, world religions, and the nones) all line up in a fairly consistent order.
In the top right, you have Latter-day Saints. They are easily the most conservative and the most Republican religious group. Then there’s a pretty big gap until you find the rest of the Christian groups. Note how closely clustered they are, too. In fact, there’s essentially no difference between Catholics, Protestants, Christians, and Orthodox Christians. They sit right in the middle of both the ideological and partisan continua.
Then you have the world religions, which are fairly clustered together, too. They average a score of 3 out of 7 on both ideology and partisanship. I do think it’s fair to say that Muslim college students tend to be a bit more centrist than Buddhists, Hindus, or Jews. However, the gap is not huge.
Then you have the three types of nones in the bottom left corner. You can see that there’s a pretty clear order, though: atheists are the most left-leaning, followed by agnostics and then the “nothings in particular.” That really tells you a lot about the God Gap in American politics in a single graph. The chasm between the red circles and blue ones is what the political future of the country looks like.
Let me visualize this in a couple of heat maps, too. I collapsed the 7-point scales into 3-point scales on both partisanship and ideology and calculated the distribution of the twelve religious groups across these nine squares.
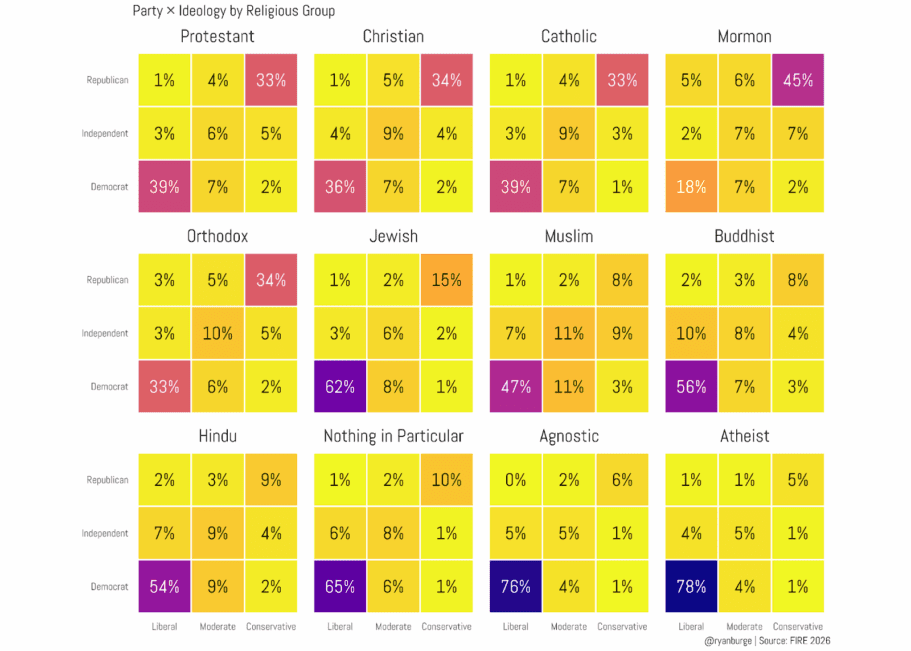
I want you to take note of something across the top row. Can you see where the largest concentrations of college students are? The top right (conservative Republicans) and the bottom left (liberal Democrats). But in the biggest traditions, those numbers are pretty much the same. It’s like Protestants and Catholics are clustered at the two ends of the political and ideological spectrum.
That’s not true for the rest of the sample found in the last two rows. For instance, 62 percent of Jews are liberal Democrats. It’s 47 percent of Muslims, 56 percent of Buddhists, and 54 percent of Hindus. The same pattern is there for the non-religious as well. Consider this: over three quarters of atheist and agnostic college students say that they are liberal Democrats. There’s no bimodality there—they are grouped around a single part of the ideological and partisan spectrum.
Doing the same analysis by level of religious attendance is also illuminating.
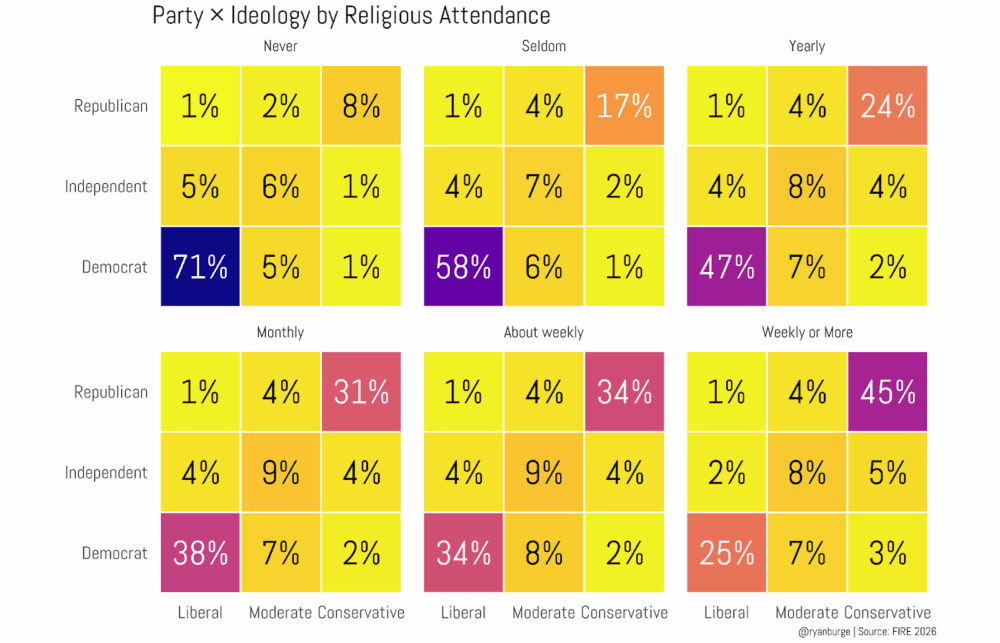
Given what we observed in the prior heat map, it should come as no surprise that the level of attendance that was the most politically unified was the never-attenders—71 percent are liberal Democrats. Meanwhile, just 8 percent are conservative Republicans. That’s a gap of 63 points. I think that’s a pretty good metric to calculate political homogeneity among these attendance categories.
For seldom-attenders, the gap is 41 points. It drops to 23 points among yearly-attenders, and it’s only 7 points for those who report monthly attendance. Then look at the weekly-attenders: 34 percent are conservative Republicans, and exactly the same percentage are liberal Democrats. But among folks who attend at least once a week, it flips the other way—45 percent are conservative Republicans and 25 percent are liberal Democrats.
I wanted to try to visualize where Christians are overrepresented across the seven levels of ideology and partisanship, so I calculated the share of Christians who could be found in each square. Then I did the same for the non-religious. The way you can read this is pretty straightforward: green squares are places where a group is overrepresented, and blue squares are where they are underrepresented.
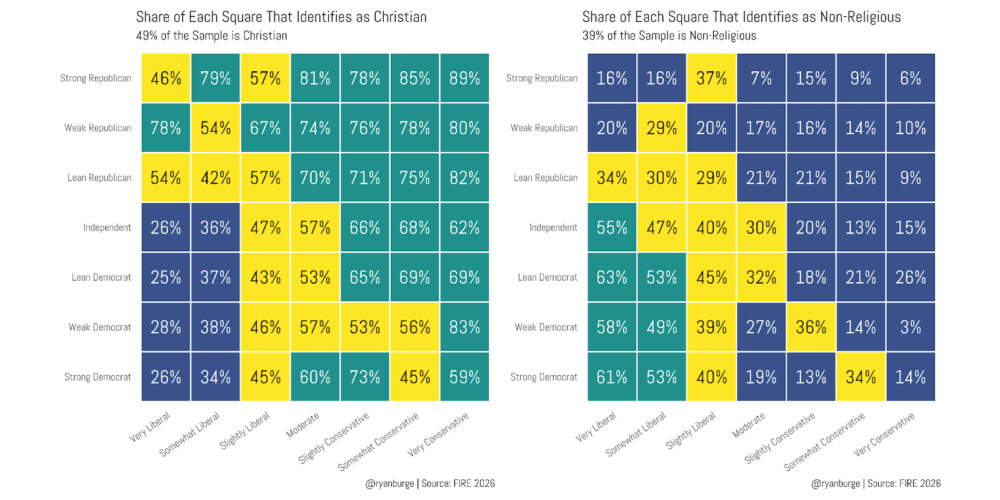
In the full sample, about 49 percent of all respondents said that they were Christians. Where do they show up the most on the heat map? It’s the top right corner—that’s the square that is ideologically conservative and Republican. Where are they more rare? The bottom left—that’s folks who are liberal Democrats.
And guess what the graph of the non-religious shows? The exact opposite of that. The nones can be found in large measure in the left-leaning part of the heat map. For instance, while the nones made up 39 percent of the entire sample, among very liberal strong Democrats, 61 percent of them said that they were atheist, agnostic, or had no religion in particular. In contrast, just 6 percent of very conservative strong Republicans were nones.
This is a real representation of how religious groups “live” in different parts of the political and ideological spectrum.
But one last observation. You know how the Christian groups above were the most politically divided? For instance, among Protestants, 39 percent were liberal Democrats and 33 percent were conservative Republicans. That’s a pretty good balance, right? I wanted to pull back the curtain by dividing the sample into the low-attending Christians and those who attend nearly every week or more.
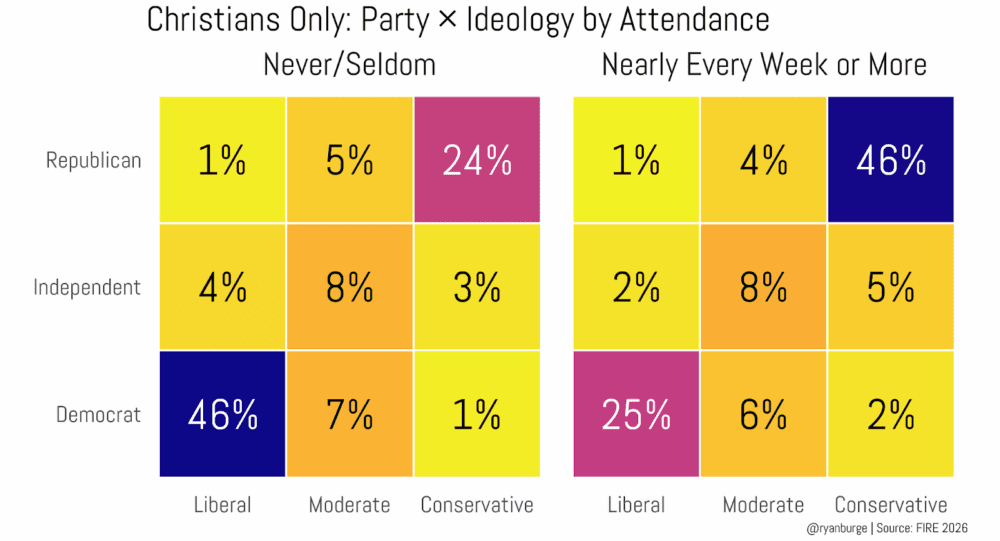
These graphs are basically the opposite of each other. Among the never/seldom-attending Christians, 46 percent are liberal Democrats and 24 percent are conservative Republicans. For those who go to church on a weekly basis, 46 percent are conservative Republicans and 25 percent are liberal Democrats. Do you see why the numbers above were so even? The heat map on the left balances the heat map on the right when you look at the numbers in the aggregate.
There’s a lot going on here, so let me summarize:
- Among Christians, their politics are divided between left and right. For most groups, the share of liberal Democrats is nearly the same as the portion who are conservative Republicans.
- The non-religious are much more politically homogeneous. About three-quarters of atheists and agnostics indicate that they are liberal Democrats.
- But the political divide among Christians is really a chasm between the active and inactive groups. A Christian who doesn’t go to Church that much is 20 points more likely to be a liberal Democrat than a conservative Republican. Among the weekly-attenders, it’s exactly the opposite.
That data does indicate that even low-attending Christian college students are less liberal than atheists, but the real difference is between the Protestants and Catholics who go to church weekly and the non-religious.
The FIRE survey asks a bunch of questions that try to understand whether these students are “self-censoring” on sensitive topics. So expect to see more on this data in the near future.